Amelia-42: An airport surface movement dataset
Amelia-42 is a large-scale airport surface movement dataset collected using the System Wide Information Management (SWIM) Surface Movement Event Service (SMES). With data collection beginning in December 2022, the dataset is continuously expanding. It covers surface movement events across 42 airports and TRACON facilities within the US National Airspace System.
NOTE: We provide instructions on how to access the processed trajectory data. Additionally, Below we provide instructions on how to download and convert the raw dataset, which contains everything captured by the SWIM system for 42 airports in the United States.
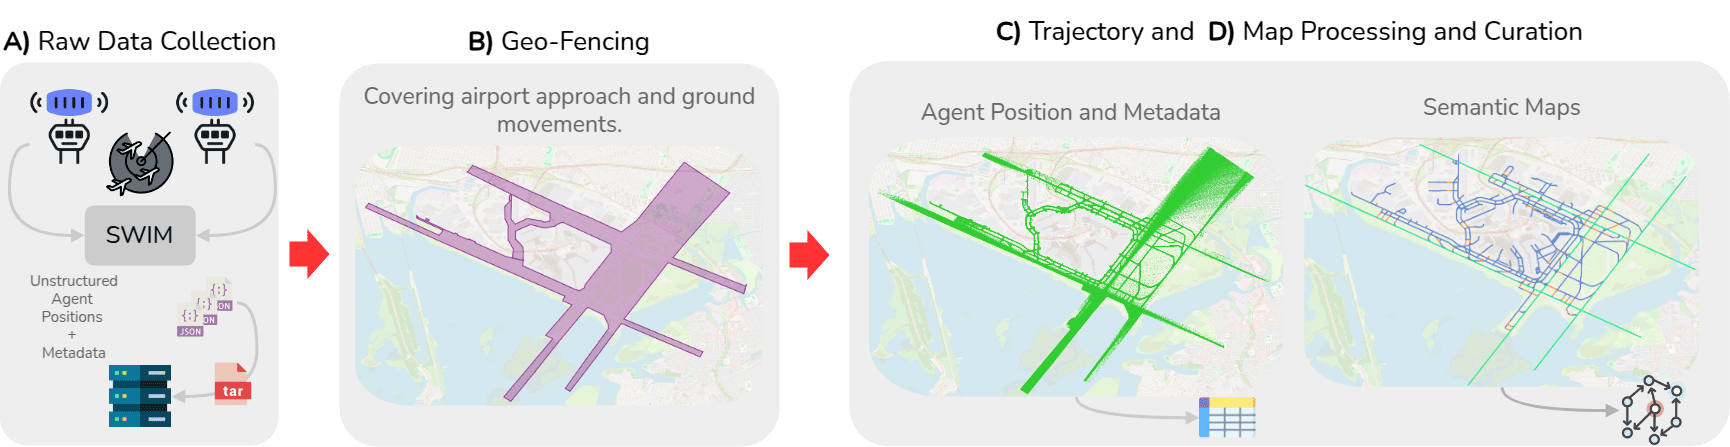
The Amelia data pipeline.
B) Airport-specific geofences are defined to delimit movement areas as well as take-off and landing extensions to runways.
C) Data within the geo-fence is processed into clean tabular 1-Hz position reports.
D) As additional context, semantic routing graphs are created for each airport.
Processed Data
 We are on HuggingFace now!
Amelia10-Bench
Click on the link below to go to the processed dataset:
We provide the processed trajectory data used for our trajectory forecasting experiments, which contains 1 month of data for each of the 10 airports:
NOTE: The full dataset is significantly larger as described in the raw data section. The following 10 airports are selected to represent a diverse range of traffic levels and map topologies.
- Boston-Logan Intl. Airport - Jan 2023
- Newark Liberty Intl. Airport - Mar 2023
- Ronald Reagan Washington Natl. Airport - April 2023
- John F. Kennedy Intl. Airport - April 2023
- Los Angeles Intl. Airport - May 2023
- Chicago-Midway Intl. Airport - June 2023
- Louis Armstrong New Orleans Intl. Airport - July 2023
- Seattle-Tacoma Intl. Airport - Aug 2023
- San Francisco Intl. Airport - Sept 2023
- Ted Stevens Anchorage Intl. Airport - Nov 2023
Amelia42-Mini
We provide the processed trajectory data for 15 days chosen randomly for each of the 42 airports:
NOTE: The full dataset is significantly larger as described in the raw data section.
Click on the link below to go to the processed dataset:
Dataset Structure
The dataset follows this structure:
|-- amelia
    |-- assets
    |    | -- airport_icao
    |    |    | -- bkg_map.png
    |    |    | -- limits.json
    |    |    | -- airport_code_from_net.osm
    |    | ...
    |-- graph_data_axxvxxos
    |    | -- airport_icao
    |    |    | -- semantic_graph.pkl
    |    |    | -- semantic_airport_icao.osm
    |    |    | -- semantic_graph.png
    |    | ...
    |-- traj_data_axxvxx
    |    | -- airport_icao
    |    |    | -- AIRPORT_ICAO_<unix_timestamp>.csv
    |    |    | ...
    |    |    | ...
    |    | ...
Assets
The assets folder has a subfolder for each airport (uses the airport’s ICAO) containing the following:
bkg_map.png: visual representation of the map, obtained using OpenStreetMap (OSM).limits.json: JSON file containing the Airport’s extents.airport_icao.osm: the airport’s map in OSM format.
Graph Data (Processed Map Information)
To generate the processed map information, we used AmeliaMaps.
The graph_data_axxvxxos folder has a subfolder for each airport containing semantic graphs representation obtained using AmeliaMaps. Each sub-folder contains the following files:
semantic_graph.pkl: contains the vectorized map graph with semantic attributes.semantic_airport_icao.osm: the semantic representation of the graph in OSM formatsemantic_graph.png: visual representation of the graph. Just shown for reference.
NOTE this folder contains the graphs for the 10 airports used in our training experiments. The full set of 42 maps is in the folder graph_data_axxvxxos.
Trajectory Data
The traj_data_axxvxx folder has a subfolder for each airport containing the trajectory data in CSV format. Each file within an airport’s subfolder represents an hour of data.
The files are named following the format AIRPORT_ICAO_<unix_timestamp>.csv. Each contains trajectory information in Table 1.
| Field | Unit | Description | Frame | # | Timestamp |
| ID | # | STDDS Agent ID |
| Range | km | Distance from airport datum |
| Bearing | rads | Bearing angle w.r.t North |
| Altitude | feet | Agent altitude (Mean Sea Level) |
| Speed | knots | Agent speed |
| Heading | degrees | Agent heading |
| Type | int | Agent type: {0: aircraft 1: vehicle, 2: unknown} |
| Lat | decimal degrees | Agent's latitude |
| Lon | decimal degrees | Agent's longitude |
| x | km | Agent's local x Cartesian position |
| y | km | Agent's local y Cartesian position |
| Interp | boolean | Interpolated data point flag |
Downloading the Dataset from Hugging Face
You can easily download the Amelia datasets using the Hugging Face Hub and the datasets library.
First, install the required package:
pip install datasets
Then, load the dataset in Python:
from datasets import load_dataset

# For Amelia42-Mini
ds = load_dataset("AmeliaCMU/Amelia42-Mini")

# For Amelia10-Bench
ds = load_dataset("AmeliaCMU/Amelia-10")
Alternatively, you can download files directly from the Hugging Face website.
Click the “Download” button or use the “Files and versions” tab to access specific files.
Raw Data
The raw data contains everything captured by the SWIM system for 42 airports in the United States. A complete list of the airports is provided in Table 2.
In order to download and convert raw data into CSV files, please follow instructions below:
Downloading and Converting raw data
-
To download the raw data, please follow the instructions in AmeliaSWIM on how to use the
download_raw.pyscript. -
To convert the raw data into CSV files, please follow the instructions in AmeliaSWIM on how to use the
process.pyscript. The resulting CSV files will contain the following information:
Downloading and Processing map data
- To download and process the map data, please follow the instructions in AmeliaMaps on how to use the processing scripts.
Data Tracker
For each of the following airports you can get the following data:
- Raw Data: Raw trajectory data.
- Processed Data: Processed trajectory data.
- Airport Map: Raster image of the airport's map.
- Semantic Graph: Semantic graph representation of the airport's map.
- Fence: GeoFence of the airport's map. GeoFence is used for capturing data within a region of interest.
- Limits File: Airport's extent information.
| Airport | Airport ICAO | |
|---|---|---|
| 1 | Hartsfield-Jackson Atlanta Intl. Airport | KATL |
| 2 | Bradley Intl. Airport | KBDL |
| 3 | Boston-Logan Intl. Airport | KBOS |
| 4 | Baltimore/Washington Intl. Thurgood Marshall Airport | KBWI |
| 5 | Cleveland Hopkins Intl. Airport | KCLE |
| 6 | Charlotte Douglas Intl. Airport | KCLT |
| 7 | Ronald Reagan Washington Natl. Airport | KDCA |
| 8 | Denver Intl. Airport | KDEN |
| 9 | Dallas/Fort Worth Intl. Airport | KDFW |
| 10 | Detroit Metropolitan Wayne County Airport | KDTW |
| 11 | Newark Liberty Intl. Airport | KEWR |
| 12 | Fort Lauderdale-Hollywood Intl. Airport | KFLL |
| 13 | William P. Hobby Airport | KHOU |
| 14 | Washington Dulles Intl. Airport | KIAD |
| 15 | George Bush Intercontinental Airport | KIAH |
| 16 | John F. Kennedy Intl. Airport | KJFK |
| 17 | McCarran Intl. Airport | KLAS |
| 18 | Los Angeles Intl. Airport | KLAX |
| 19 | LaGuardia Airport | KLGA |
| 20 | Kansas City Intl. Airport | KMCI |
| 21 | Orlando Intl. Airport | KMCO |
| 22 | Chicago-Midway Intl. Airport | KMDW |
| 23 | Memphis Intl. Airport | KMEM |
| 24 | Miami Intl. Airport | KMIA |
| 25 | Milwaukee Mitchell Intl. Airport | KMKE |
| 26 | Minneapolis-Saint Paul Intl. Airport | KMSP |
| 27 | Louis Armstrong New Orleans Intl. Airport | KMSY |
| 28 | O'Hare Intl. Airport | KORD |
| 29 | Portland Intl. Airport | KPDX |
| 30 | Philadelphia Intl. Airport | KPHL |
| 31 | Phoenix Sky Harbor Intl. Airport | KPHX |
| 32 | Pittsburgh Intl. Airport | KPIT |
| 33 | T.F. Green Airport | KPVD |
| 34 | San Diego Intl. Airport | KSAN |
| 35 | Louisville Muhammad Ali Intl. Airport | KSDF |
| 36 | Seattle-Tacoma Intl. Airport | KSEA |
| 37 | San Francisco Intl. Airport | KSFO |
| 38 | Salt Lake City Intl. Airport | KSLC |
| 39 | John Wayne Airport | KSNA |
| 40 | St. Louis Lambert Intl. Airport | KSTL |
| 41 | Ted Stevens Anchorage Intl. Airport | PANC |
| 42 | Daniel K. Inouye Intl. Airport | PHNL |
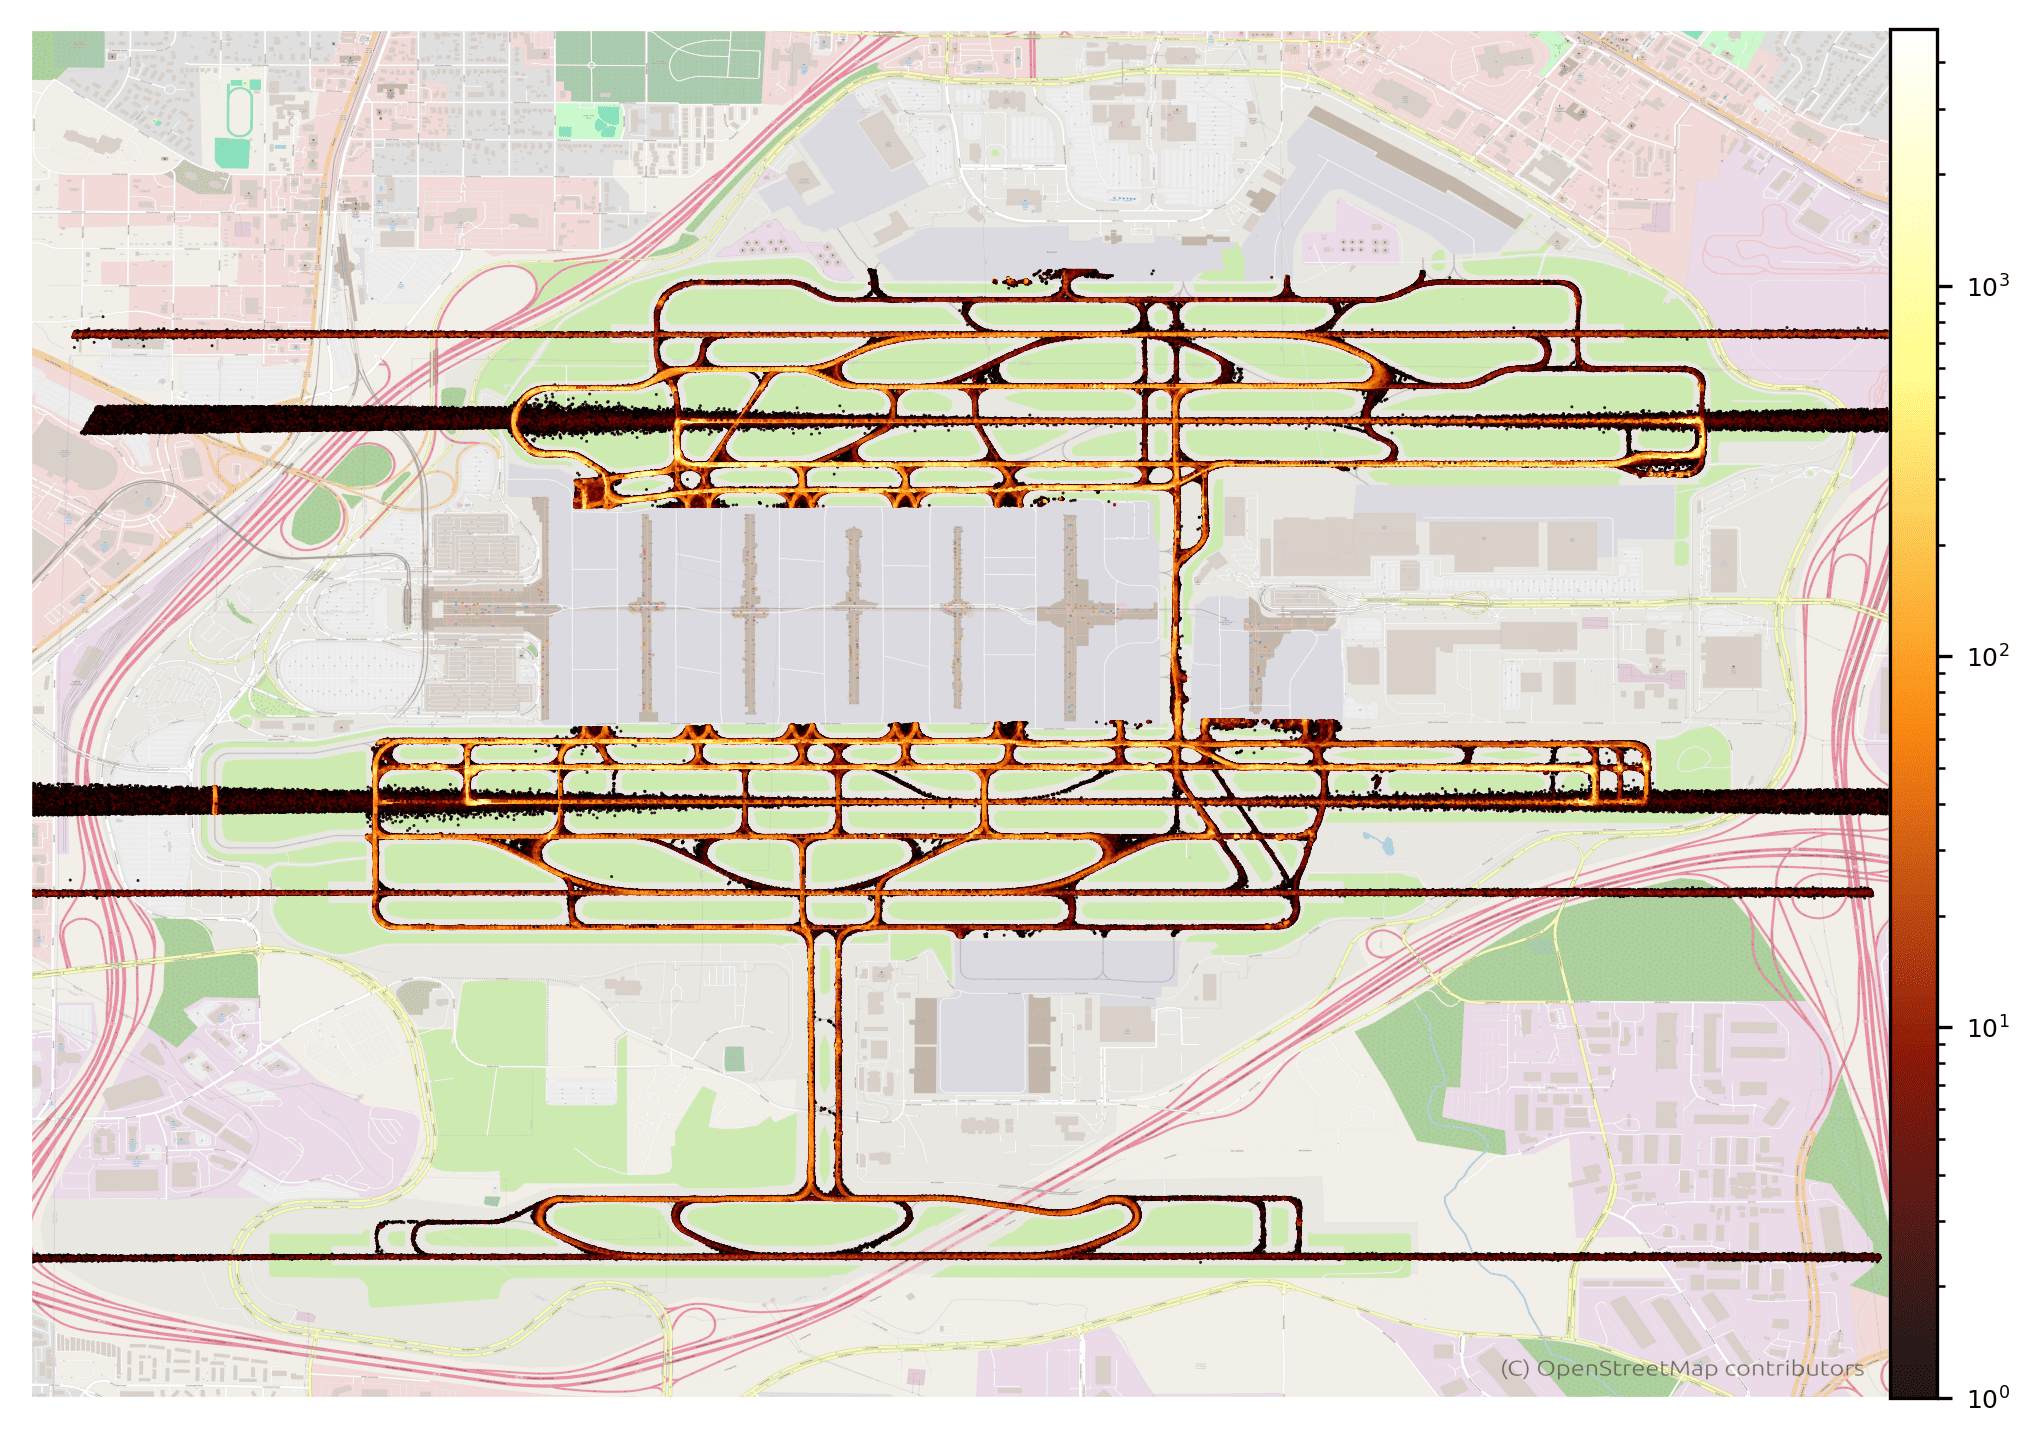
Airport’s heatmap, representing the activity frequency per region
Ethics Statement
“Amelia is compliant with the FAA Terms of Service for data redistribution as well as the privacy and safety filters imposed by the FAA. Although the Amelia dataset is based on the FAA SWIM data, Amelia is NOT official FAA data and is not suitable for operational purposes. Amelia should only be used for research purposes. Our collection methodology comes with inherent limitations, such as noise in ground radar as well as noisy labelling of agents in the dataset.”
BibTeX
If you find our work useful in your research, please cite us!
@inbook{navarro2024amelia,
  author = {Ingrid Navarro and Pablo Ortega and Jay Patrikar and Haichuan Wang and Zelin Ye and Jong Hoon Park and Jean Oh and Sebastian Scherer},
  title = {AmeliaTF: A Large Model and Dataset for Airport Surface Movement Forecasting},
  booktitle = {AIAA AVIATION FORUM AND ASCEND 2024},
  chapter = {},
  pages = {},
  doi = {10.2514/6.2024-4251},
  URL = {https://arc.aiaa.org/doi/abs/10.2514/6.2024-4251},
  eprint = {https://arc.aiaa.org/doi/pdf/10.2514/6.2024-4251},
}